K8S之日志监控
- 一、Log and Monitor
- 1.1 Log
- 1.1.1 容器级别
- 1.1.2 Pod级别
- 1.1.3 组件服务级别
- 1.1.4 LogPilot + ES + Kibana
- 1.2 Monitor
- 1.2.1 Prometheus简介
- 1.2.2 Prometheus架构
- 1.2.3 Prometheus知识普及
- 1.2.4 数据采集
- 1.2.5 Prometheus + Grafana
- 二、Trouble Shooting(问题排查)
- 2.1 Master
- 2.2 Worker
- 2.3 Addons
- 2.4 系统问题排查
- 2.5 Pod的问题排查
一、Log and Monitor
1.1 Log
1.1.1 容器级别
docker命令查看
docker ps --->containerid
docker logs containerid --->查看容器的日志情况
kubectl命令查看
kubectl logs -f <pod-name> -c <container-name>
1.1.2 Pod级别
kubectl describe pod springboot-demo-68b89b96b6-sl8bq
当然,kubectl describe除了能够查看pod的日志信息,还能查看比如Node、RC、Service、Namespace等信
息。
注意 :要是想查看指定命名空间之下的,可以-n=namespace
1.1.3 组件服务级别
比如kube-apiserver、kube-schedule、kubelet、kube-proxy、kube-controller-manager等
可以使用journalctl进行查看
journalctl -u kubelet
1.1.4 LogPilot + ES + Kibana
网址:https://github.com/AliyunContainerService/log-pilot

部署logpilot
(1)创建log-pilot.yaml
---
apiVersion: extensions/v1beta1
kind: DaemonSet
metadata:
  name: log-pilot
  namespace: kube-system
  labels:
    k8s-app: log-pilot
    kubernetes.io/cluster-service: "true"
spec:
  template:
    metadata:
      labels:
        k8s-app: log-es
        kubernetes.io/cluster-service: "true"
        version: v1.22
    spec:
      tolerations:
      - key: node-role.kubernetes.io/master
        effect: NoSchedule
      containers:
      - name: log-pilot
        image: registry.cn-hangzhou.aliyuncs.com/log-monitor/log-pilot:0.9-filebeat
        resources:
          limits:
            memory: 200Mi
          requests:
            cpu: 100m
            memory: 200Mi
        env:
          - name: "FILEBEAT_OUTPUT"
            value: "elasticsearch"
          - name: "ELASTICSEARCH_HOST"
            value: "elasticsearch-api"
          - name: "ELASTICSEARCH_PORT"
            value: "9200"
          - name: "ELASTICSEARCH_USER"
            value: "elastic"
          - name: "ELASTICSEARCH_PASSWORD"
            value: "changeme"
        volumeMounts:
        - name: sock
          mountPath: /var/run/docker.sock
        - name: root
          mountPath: /host
          readOnly: true
        - name: varlib
          mountPath: /var/lib/filebeat
        - name: varlog
          mountPath: /var/log/filebeat
        securityContext:
          capabilities:
            add:
            - SYS_ADMIN
      terminationGracePeriodSeconds: 30
      volumes:
      - name: sock
        hostPath:
          path: /var/run/docker.sock
      - name: root
        hostPath:
          path: /
      - name: varlib
        hostPath:
          path: /var/lib/filebeat
          type: DirectoryOrCreate
      - name: varlog
        hostPath:
          path: /var/log/filebeat
          type: DirectoryOrCreate
命令:
kubectl apply -f log-pilot.yaml
(2)查看pod和daemonset的信息
kubectl get pods -n kube-system
kubectl get pods -n kube-system -o wide | grep log
kubectl get ds -n kube-system
部署elasticsearch
(1)创建elasticsearch.yaml
---
apiVersion: v1
kind: Service
metadata:
  name: elasticsearch-api
  namespace: kube-system
  labels:
    name: elasticsearch
spec:
  selector:
    app: es
  ports:
  - name: transport
    port: 9200
    protocol: TCP
---
apiVersion: v1
kind: Service
metadata:
  name: elasticsearch-discovery
  namespace: kube-system
  labels:
    name: elasticsearch
spec:
  selector:
    app: es
  ports:
  - name: transport
    port: 9300
    protocol: TCP
---
apiVersion: apps/v1beta1
kind: StatefulSet
metadata:
  name: elasticsearch
  namespace: kube-system
  labels:
    kubernetes.io/cluster-service: "true"
spec:
  replicas: 3
  serviceName: "elasticsearch-service"
  selector:
    matchLabels:
      app: es
  template:
    metadata:
      labels:
        app: es
    spec:
      tolerations:
      - effect: NoSchedule
        key: node-role.kubernetes.io/master
      initContainers:
      - name: init-sysctl
        image: busybox:1.27
        command:
        - sysctl
        - -w
        - vm.max_map_count=262144
        securityContext:
          privileged: true
      containers:
      - name: elasticsearch
        image: registry.cn-hangzhou.aliyuncs.com/log-monitor/elasticsearch:v5.5.1
        ports:
        - containerPort: 9200
          protocol: TCP
        - containerPort: 9300
          protocol: TCP
        securityContext:
          capabilities:
            add:
              - IPC_LOCK
              - SYS_RESOURCE
        resources:
          limits:
            memory: 4000Mi
          requests:
            cpu: 100m
            memory: 2000Mi
        env:
          - name: "http.host"
            value: "0.0.0.0"
          - name: "network.host"
            value: "_eth0_"
          - name: "cluster.name"
            value: "docker-cluster"
          - name: "bootstrap.memory_lock"
            value: "false"
          - name: "discovery.zen.ping.unicast.hosts"
            value: "elasticsearch-discovery"
          - name: "discovery.zen.ping.unicast.hosts.resolve_timeout"
            value: "10s"
          - name: "discovery.zen.ping_timeout"
            value: "6s"
          - name: "discovery.zen.minimum_master_nodes"
            value: "2"
          - name: "discovery.zen.fd.ping_interval"
            value: "2s"
          - name: "discovery.zen.no_master_block"
            value: "write"
          - name: "gateway.expected_nodes"
            value: "2"
          - name: "gateway.expected_master_nodes"
            value: "1"
          - name: "transport.tcp.connect_timeout"
            value: "60s"
          - name: "ES_JAVA_OPTS"
            value: "-Xms2g -Xmx2g"
        livenessProbe:
          tcpSocket:
            port: transport
          initialDelaySeconds: 20
          periodSeconds: 10
        volumeMounts:
        - name: es-data
          mountPath: /data
      terminationGracePeriodSeconds: 30
      volumes:
      - name: es-data
        hostPath:
          path: /es-data
命令:
kubectl apply -f elasticsearch.yaml
kubectl get pods -n kube-system
kubectl get pods -n kube-system -o wide | grep ela
(2)查看kube-system下的svc
kubectl get svc -n kube-system
elasticsearch-api ClusterIP 10.106.65.2 <none> 9200/TCP
elasticsearch-discovery ClusterIP 10.101.117.180 <none> 9300/TCP
kube-dns ClusterIP 10.96.0.10 <none>
(3)查看kube-system下的statefulset
kubectl get statefulset -n kube-system
NAME READY AGE
elasticsearch 3/3 106s
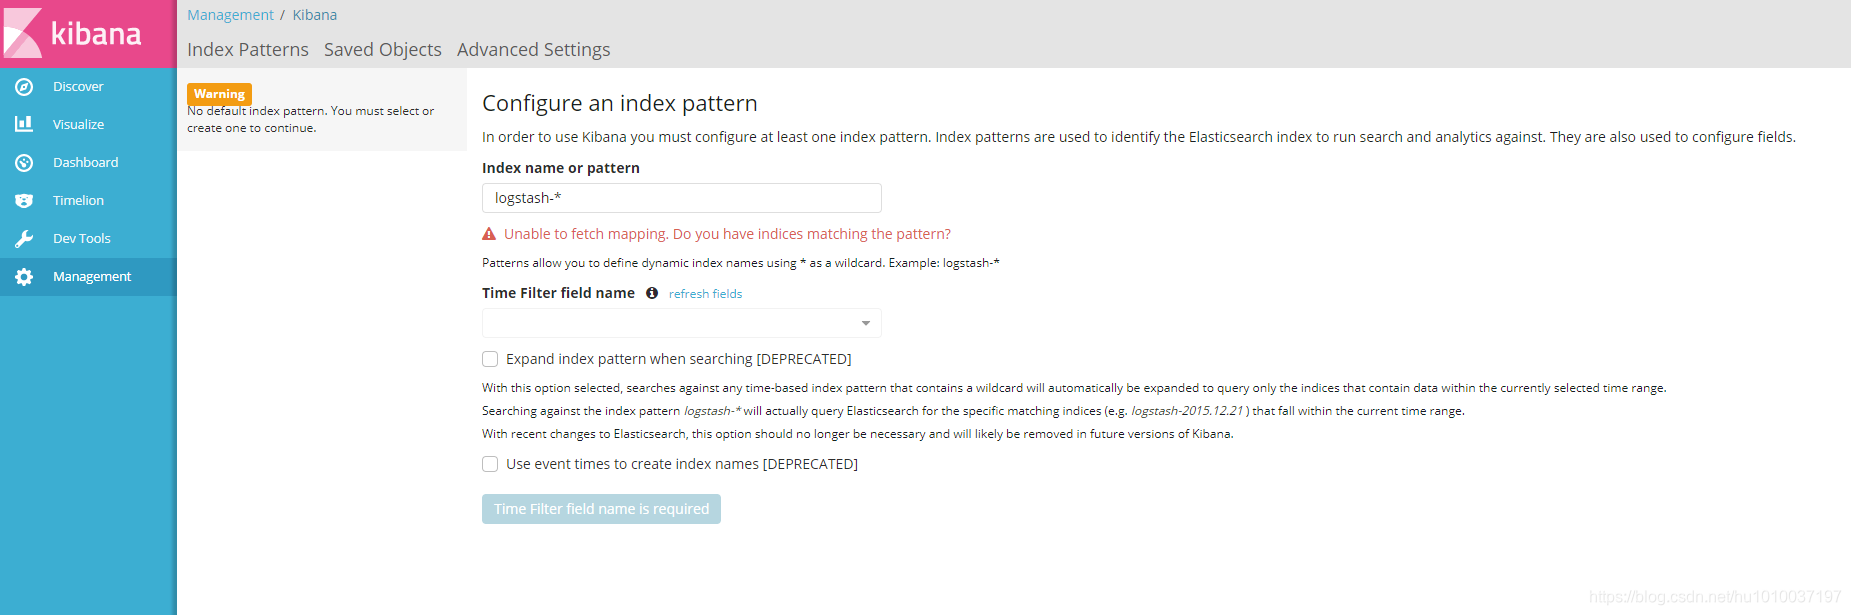
部署kibana
(1)创建kibana.yaml
kibana主要是对外提供访问的,所以这边需要配置Service和Ingress
前提: 要有Ingress Controller的支持,比如Nginx Controller
---
# Deployment
apiVersion: apps/v1beta1
kind: Deployment
metadata:
  name: kibana
  namespace: kube-system
  labels:
    component: kibana
spec:
  replicas: 1
  selector:
    matchLabels:
     component: kibana
  template:
    metadata:
      labels:
        component: kibana
    spec:
      containers:
      - name: kibana
        image: registry.cn-hangzhou.aliyuncs.com/log-monitor/kibana:v5.5.1
        env:
        - name: CLUSTER_NAME
          value: docker-cluster
        - name: ELASTICSEARCH_URL
          value: http://elasticsearch-api:9200/
        resources:
          limits:
            cpu: 1000m
          requests:
            cpu: 100m
        ports:
        - containerPort: 5601
          name: http
---
# Service
apiVersion: v1
kind: Service
metadata:
  name: kibana
  namespace: kube-system
  labels:
    component: kibana
spec:
  selector:
    component: kibana
  ports:
  - name: http
    port: 80
    targetPort: http
---
# Ingress
apiVersion: extensions/v1beta1
kind: Ingress
metadata:
  name: kibana
  namespace: kube-system
spec:
  rules:
  - host: log.k8s.itcrazy2016.com
    http:
      paths:
      - path: /
        backend:
          serviceName: kibana
          servicePort: 80
命令:
kubectl apply -f kibana.yaml
(2)查看pod和deployment的信息
kubectl get pods -n kube-system | grep ki
kubectl get deploy -n kube-system
(3)配置Ingress需要的域名
打开windows上的hosts文件
# 注意这边是worker01的IP
121.41.10.126 kibana.jack.com
(4)在windows访问kibana.jack.com
1.2 Monitor
1.2.1 Prometheus简介
官网 :https://prometheus.io/
github :https://github.com/kubernetes/kubernetes/tree/master/cluster/addons/prometheus
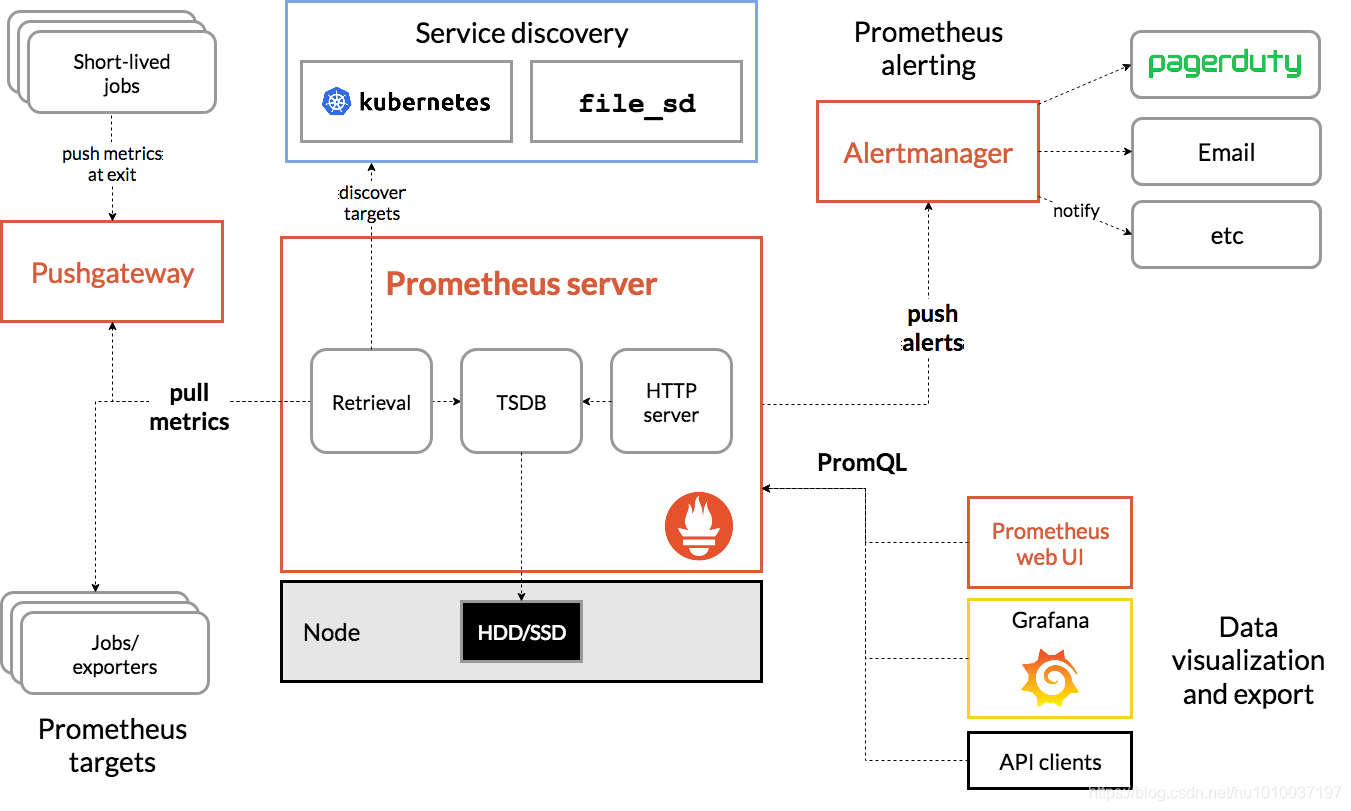
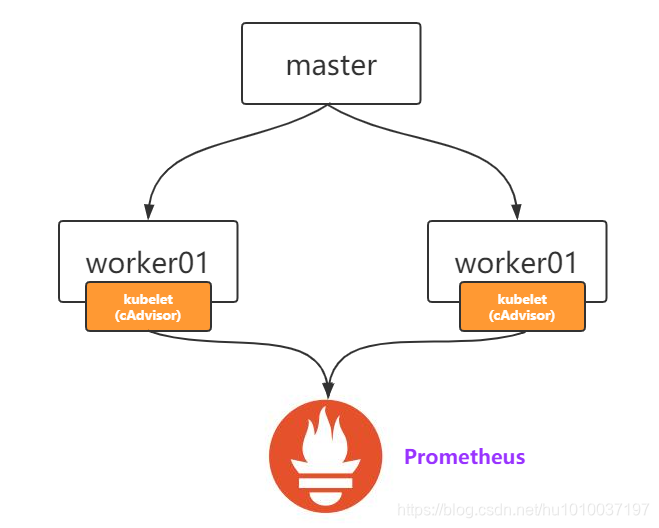
1.2.2 Prometheus架构
1.2.3 Prometheus知识普及
- 支持pull、push数据添加方式
- 支持k8s服务发现
- 提供查询语言PromQL
- 时序(time series)是由名字(Metric)以及一组key/value标签定义的
- 数据类型
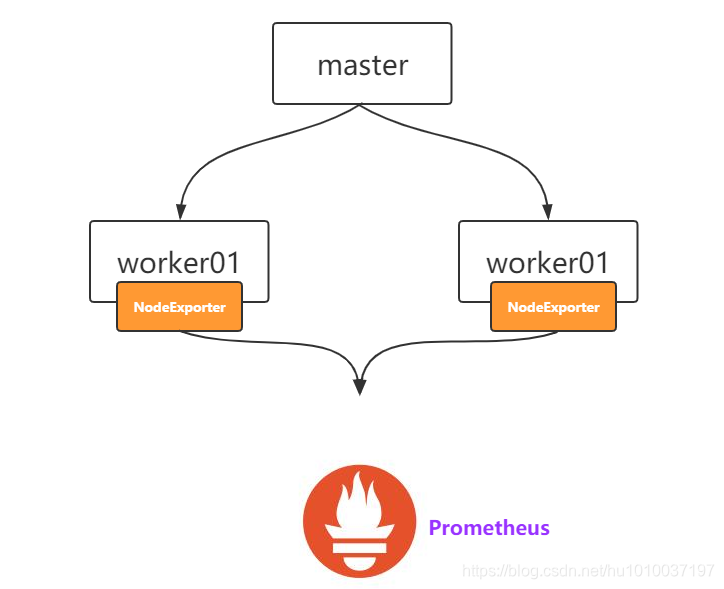
1.2.4 数据采集
2.2.4.1 服务器数据
通过NodeExporter:https://github.com/prometheus/node_exporter
2.2.4.2 组件数据
ETCD:https://ip:2379/metrics
APIServer:https://ip:6443/metrics
ControllerManager:https://ip:10252/metrics
Scheduler:https://ip:10251/metrics
2.2.4.3 容器数据
1.2.5 Prometheus + Grafana
在master上创建prometheus目录
网盘/课堂源码/*.yaml
namespace.yaml
node-exporter.yaml
prometheus.yaml
grafana.yaml
ingress.yaml
(1)创建命名空间ns-monitor
namespace.yaml
apiVersion: v1
kind: Namespace
metadata:
  name: ns-monitor
  labels:
    name: ns-monitor
命令:
kubectl apply -f namespace.yaml
kubectl get namespace
(2)创建node-exporter
node-exporter.yaml
kind: DaemonSet
apiVersion: apps/v1beta2
metadata:
  labels:
    app: node-exporter
  name: node-exporter
  namespace: ns-monitor
spec:
  revisionHistoryLimit: 10
  selector:
    matchLabels:
      app: node-exporter
  template:
    metadata:
      labels:
        app: node-exporter
    spec:
      containers:
        - name: node-exporter
          image: prom/node-exporter:v0.16.0
          ports:
            - containerPort: 9100
              protocol: TCP
              name:	http
      hostNetwork: true
      hostPID: true
      tolerations:
        - effect: NoSchedule
          operator: Exists

---
kind: Service
apiVersion: v1
metadata:
  labels:
    app: node-exporter
  name: node-exporter-service
  namespace: ns-monitor
spec:
  ports:
    - name:	http
      port: 9100
      nodePort: 31672
      protocol: TCP
  type: NodePort
  selector:
    app: node-exporter
命令:
kubectl apply -f node-exporter.yaml
kubectl get pod -n ns-monitor
kubectl get svc -n ns-monitor
kubectl get ds -n ns-monitor
win浏览器访问集群任意一个ip,比如http://121.41.10.126:31672 查看结果 # 这边是http协议,不能用https
(3)部署prometheus pod(包含rbac认证、ConfigMap等)
创建prometheus.yaml:
注意 :记得修改prometheus.yaml文件中的ip为master的ip和path[PV需要使用到]
---
apiVersion: rbac.authorization.k8s.io/v1beta1
kind: ClusterRole
metadata:
  name: prometheus
rules:
  - apiGroups: [""] # "" indicates the core API group
    resources:
      - nodes
      - nodes/proxy
      - services
      - endpoints
      - pods
    verbs:
      - get
      - watch
      - list
  - apiGroups:
      - extensions
    resources:
      - ingresses
    verbs:
      - get
      - watch
      - list
  - nonResourceURLs: ["/metrics"]
    verbs:
      - get
---
apiVersion: v1
kind: ServiceAccount
metadata:
  name: prometheus
  namespace: ns-monitor
  labels:
    app: prometheus
---
apiVersion: rbac.authorization.k8s.io/v1beta1
kind: ClusterRoleBinding
metadata:
  name: prometheus
subjects:
  - kind: ServiceAccount
    name: prometheus
    namespace: ns-monitor
roleRef:
  kind: ClusterRole
  name: prometheus
  apiGroup: rbac.authorization.k8s.io
---
apiVersion: v1
kind: ConfigMap
metadata:
  name: prometheus-conf
  namespace: ns-monitor
  labels:
    app: prometheus
data:
  prometheus.yml: |-
    # my global config
    global:
      scrape_interval:     15s # Set the scrape interval to every 15 seconds. Default is every 1 minute.
      evaluation_interval: 15s # Evaluate rules every 15 seconds. The default is every 1 minute.
      # scrape_timeout is set to the global default (10s).

    # Alertmanager configuration
    alerting:
      alertmanagers:
      - static_configs:
        - targets:
          # - alertmanager:9093

    # Load rules once and periodically evaluate them according to the global 'evaluation_interval'.
    rule_files:
      # - "first_rules.yml"
      # - "second_rules.yml"

    # A scrape configuration containing exactly one endpoint to scrape:
    # Here it's Prometheus itself.
    scrape_configs:
      # The job name is added as a label `job=<job_name>` to any timeseries scraped from this config.
      - job_name: 'prometheus'

        # metrics_path defaults to '/metrics'
        # scheme defaults to 'http'.

        static_configs:
          - targets: ['localhost:9090']
      - job_name: 'grafana'
        static_configs:
          - targets:
              - 'grafana-service.ns-monitor:3000'

      - job_name: 'kubernetes-apiservers'

        kubernetes_sd_configs:
        - role: endpoints

        # Default to scraping over https. If required, just disable this or change to
        # `http`.
        scheme: https

        # This TLS & bearer token file config is used to connect to the actual scrape
        # endpoints for cluster components. This is separate to discovery auth
        # configuration because discovery & scraping are two separate concerns in
        # Prometheus. The discovery auth config is automatic if Prometheus runs inside
        # the cluster. Otherwise, more config options have to be provided within the
        # <kubernetes_sd_config>.
        tls_config:
          ca_file: /var/run/secrets/kubernetes.io/serviceaccount/ca.crt
          # If your node certificates are self-signed or use a different CA to the
          # master CA, then disable certificate verification below. Note that
          # certificate verification is an integral part of a secure infrastructure
          # so this should only be disabled in a controlled environment. You can
          # disable certificate verification by uncommenting the line below.
          #
          # insecure_skip_verify: true
        bearer_token_file: /var/run/secrets/kubernetes.io/serviceaccount/token

        # Keep only the default/kubernetes service endpoints for the https port. This
        # will add targets for each API server which Kubernetes adds an endpoint to
        # the default/kubernetes service.
        relabel_configs:
        - source_labels: [__meta_kubernetes_namespace, __meta_kubernetes_service_name, __meta_kubernetes_endpoint_port_name]
          action: keep
          regex: default;kubernetes;https

      # Scrape config for nodes (kubelet).
      #
      # Rather than connecting directly to the node, the scrape is proxied though the
      # Kubernetes apiserver.  This means it will work if Prometheus is running out of
      # cluster, or can't connect to nodes for some other reason (e.g. because of
      # firewalling).
      - job_name: 'kubernetes-nodes'

        # Default to scraping over https. If required, just disable this or change to
        # `http`.
        scheme: https

        # This TLS & bearer token file config is used to connect to the actual scrape
        # endpoints for cluster components. This is separate to discovery auth
        # configuration because discovery & scraping are two separate concerns in
        # Prometheus. The discovery auth config is automatic if Prometheus runs inside
        # the cluster. Otherwise, more config options have to be provided within the
        # <kubernetes_sd_config>.
        tls_config:
          ca_file: /var/run/secrets/kubernetes.io/serviceaccount/ca.crt
        bearer_token_file: /var/run/secrets/kubernetes.io/serviceaccount/token

        kubernetes_sd_configs:
        - role: node

        relabel_configs:
        - action: labelmap
          regex: __meta_kubernetes_node_label_(.+)
        - target_label: __address__
          replacement: kubernetes.default.svc:443
        - source_labels: [__meta_kubernetes_node_name]
          regex: (.+)
          target_label: __metrics_path__
          replacement: /api/v1/nodes/${1}/proxy/metrics

      # Scrape config for Kubelet cAdvisor.
      #
      # This is required for Kubernetes 1.7.3 and later, where cAdvisor metrics
      # (those whose names begin with 'container_') have been removed from the
      # Kubelet metrics endpoint.  This job scrapes the cAdvisor endpoint to
      # retrieve those metrics.
      #
      # In Kubernetes 1.7.0-1.7.2, these metrics are only exposed on the cAdvisor
      # HTTP endpoint; use "replacement: /api/v1/nodes/${1}:4194/proxy/metrics"
      # in that case (and ensure cAdvisor's HTTP server hasn't been disabled with
      # the --cadvisor-port=0 Kubelet flag).
      #
      # This job is not necessary and should be removed in Kubernetes 1.6 and
      # earlier versions, or it will cause the metrics to be scraped twice.
      - job_name: 'kubernetes-cadvisor'

        # Default to scraping over https. If required, just disable this or change to
        # `http`.
        scheme: https

        # This TLS & bearer token file config is used to connect to the actual scrape
        # endpoints for cluster components. This is separate to discovery auth
        # configuration because discovery & scraping are two separate concerns in
        # Prometheus. The discovery auth config is automatic if Prometheus runs inside
        # the cluster. Otherwise, more config options have to be provided within the
        # <kubernetes_sd_config>.
        tls_config:
          ca_file: /var/run/secrets/kubernetes.io/serviceaccount/ca.crt
        bearer_token_file: /var/run/secrets/kubernetes.io/serviceaccount/token

        kubernetes_sd_configs:
        - role: node

        relabel_configs:
        - action: labelmap
          regex: __meta_kubernetes_node_label_(.+)
        - target_label: __address__
          replacement: kubernetes.default.svc:443
        - source_labels: [__meta_kubernetes_node_name]
          regex: (.+)
          target_label: __metrics_path__
          replacement: /api/v1/nodes/${1}/proxy/metrics/cadvisor

      # Scrape config for service endpoints.
      #
      # The relabeling allows the actual service scrape endpoint to be configured
      # via the following annotations:
      #
      # * `prometheus.io/scrape`: Only scrape services that have a value of `true`
      # * `prometheus.io/scheme`: If the metrics endpoint is secured then you will need
      # to set this to `https` & most likely set the `tls_config` of the scrape config.
      # * `prometheus.io/path`: If the metrics path is not `/metrics` override this.
      # * `prometheus.io/port`: If the metrics are exposed on a different port to the
      # service then set this appropriately.
      - job_name: 'kubernetes-service-endpoints'

        kubernetes_sd_configs:
        - role: endpoints

        relabel_configs:
        - source_labels: [__meta_kubernetes_service_annotation_prometheus_io_scrape]
          action: keep
          regex: true
        - source_labels: [__meta_kubernetes_service_annotation_prometheus_io_scheme]
          action: replace
          target_label: __scheme__
          regex: (https?)
        - source_labels: [__meta_kubernetes_service_annotation_prometheus_io_path]
          action: replace
          target_label: __metrics_path__
          regex: (.+)
        - source_labels: [__address__, __meta_kubernetes_service_annotation_prometheus_io_port]
          action: replace
          target_label: __address__
          regex: ([^:]+)(?::\d+)?;(\d+)
          replacement: $1:$2
        - action: labelmap
          regex: __meta_kubernetes_service_label_(.+)
        - source_labels: [__meta_kubernetes_namespace]
          action: replace
          target_label: kubernetes_namespace
        - source_labels: [__meta_kubernetes_service_name]
          action: replace
          target_label: kubernetes_name

      # Example scrape config for probing services via the Blackbox Exporter.
      #
      # The relabeling allows the actual service scrape endpoint to be configured
      # via the following annotations:
      #
      # * `prometheus.io/probe`: Only probe services that have a value of `true`
      - job_name: 'kubernetes-services'

        metrics_path: /probe
        params:
          module: [http_2xx]

        kubernetes_sd_configs:
        - role: service

        relabel_configs:
        - source_labels: [__meta_kubernetes_service_annotation_prometheus_io_probe]
          action: keep
          regex: true
        - source_labels: [__address__]
          target_label: __param_target
        - target_label: __address__
          replacement: blackbox-exporter.example.com:9115
        - source_labels: [__param_target]
          target_label: instance
        - action: labelmap
          regex: __meta_kubernetes_service_label_(.+)
        - source_labels: [__meta_kubernetes_namespace]
          target_label: kubernetes_namespace
        - source_labels: [__meta_kubernetes_service_name]
          target_label: kubernetes_name

      # Example scrape config for probing ingresses via the Blackbox Exporter.
      #
      # The relabeling allows the actual ingress scrape endpoint to be configured
      # via the following annotations:
      #
      # * `prometheus.io/probe`: Only probe services that have a value of `true`
      - job_name: 'kubernetes-ingresses'

        metrics_path: /probe
        params:
          module: [http_2xx]

        kubernetes_sd_configs:
          - role: ingress

        relabel_configs:
          - source_labels: [__meta_kubernetes_ingress_annotation_prometheus_io_probe]
            action: keep
            regex: true
          - source_labels: [__meta_kubernetes_ingress_scheme,__address__,__meta_kubernetes_ingress_path]
            regex: (.+);(.+);(.+)
            replacement: ${1}://${2}${3}
            target_label: __param_target
          - target_label: __address__
            replacement: blackbox-exporter.example.com:9115
          - source_labels: [__param_target]
            target_label: instance
          - action: labelmap
            regex: __meta_kubernetes_ingress_label_(.+)
          - source_labels: [__meta_kubernetes_namespace]
            target_label: kubernetes_namespace
          - source_labels: [__meta_kubernetes_ingress_name]
            target_label: kubernetes_name

      # Example scrape config for pods
      #
      # The relabeling allows the actual pod scrape endpoint to be configured via the
      # following annotations:
      #
      # * `prometheus.io/scrape`: Only scrape pods that have a value of `true`
      # * `prometheus.io/path`: If the metrics path is not `/metrics` override this.
      # * `prometheus.io/port`: Scrape the pod on the indicated port instead of the
      # pod's declared ports (default is a port-free target if none are declared).
      - job_name: 'kubernetes-pods'

        kubernetes_sd_configs:
        - role: pod

        relabel_configs:
        - source_labels: [__meta_kubernetes_pod_annotation_prometheus_io_scrape]
          action: keep
          regex: true
        - source_labels: [__meta_kubernetes_pod_annotation_prometheus_io_path]
          action: replace
          target_label: __metrics_path__
          regex: (.+)
        - source_labels: [__address__, __meta_kubernetes_pod_annotation_prometheus_io_port]
          action: replace
          regex: ([^:]+)(?::\d+)?;(\d+)
          replacement: $1:$2
          target_label: __address__
        - action: labelmap
          regex: __meta_kubernetes_pod_label_(.+)
        - source_labels: [__meta_kubernetes_namespace]
          action: replace
          target_label: kubernetes_namespace
        - source_labels: [__meta_kubernetes_pod_name]
          action: replace
          target_label: kubernetes_pod_name
---
apiVersion: v1
kind: ConfigMap
metadata:
  name: prometheus-rules
  namespace: ns-monitor
  labels:
    app: prometheus
data:
  cpu-usage.rule: |
    groups:
      - name: NodeCPUUsage
        rules:
          - alert: NodeCPUUsage
            expr: (100 - (avg by (instance) (irate(node_cpu{name="node-exporter",mode="idle"}[5m])) * 100)) > 75
            for: 2m
            labels:
              severity: "page"
            annotations:
              summary: "{{$labels.instance}}: High CPU usage detected"
              description: "{{$labels.instance}}: CPU usage is above 75% (current value is: {{ $value }})"
---
apiVersion: v1
kind: PersistentVolume
metadata:
  name: "prometheus-data-pv"
  labels:
    name: prometheus-data-pv
    release: stable
spec:
  capacity:
    storage: 5Gi
  accessModes:
    - ReadWriteOnce
  persistentVolumeReclaimPolicy: Recycle
  nfs:
    path: /nfs/data/prometheus
    server: 121.41.10.13

---
apiVersion: v1
kind: PersistentVolumeClaim
metadata:
  name: prometheus-data-pvc
  namespace: ns-monitor
spec:
  accessModes:
    - ReadWriteOnce
  resources:
    requests:
      storage: 5Gi
  selector:
    matchLabels:
      name: prometheus-data-pv
      release: stable

---
kind: Deployment
apiVersion: apps/v1beta2
metadata:
  labels:
    app: prometheus
  name: prometheus
  namespace: ns-monitor
spec:
  replicas: 1
  revisionHistoryLimit: 10
  selector:
    matchLabels:
      app: prometheus
  template:
    metadata:
      labels:
        app: prometheus
    spec:
      serviceAccountName: prometheus
      securityContext:
        runAsUser: 0
      containers:
        - name: prometheus
          image: prom/prometheus:latest
          imagePullPolicy: IfNotPresent
          volumeMounts:
            - mountPath: /prometheus
              name: prometheus-data-volume
            - mountPath: /etc/prometheus/prometheus.yml
              name: prometheus-conf-volume
              subPath: prometheus.yml
            - mountPath: /etc/prometheus/rules
              name: prometheus-rules-volume
          ports:
            - containerPort: 9090
              protocol: TCP
      volumes:
        - name: prometheus-data-volume
          persistentVolumeClaim:
            claimName: prometheus-data-pvc
        - name: prometheus-conf-volume
          configMap:
            name: prometheus-conf
        - name: prometheus-rules-volume
          configMap:
            name: prometheus-rules
      tolerations:
        - key: node-role.kubernetes.io/master
          effect: NoSchedule

---
kind: Service
apiVersion: v1
metadata:
  annotations:
    prometheus.io/scrape: 'true'
  labels:
    app: prometheus
  name: prometheus-service
  namespace: ns-monitor
spec:
  ports:
    - port: 9090
      targetPort: 9090
  selector:
    app: prometheus
  type: NodePort
命令:
kubectl apply -f grafana.yaml
kubectl get pod -n ns-monitor
kubectl get svc -n ns-monitor
win浏览器访问集群任意一个ip:32405/graph/login
比如http://121.41.10.126:32727用户名密码:admin
(5)增加域名访问[没有域名好像没有灵魂]
创建ingress.yaml
前提 :配置好ingress controller和域名解析
apiVersion: v1
kind: PersistentVolume
metadata:
  name: "grafana-data-pv"
  labels:
    name: grafana-data-pv
    release: stable
spec:
  capacity:
    storage: 5Gi
  accessModes:
    - ReadWriteOnce
  persistentVolumeReclaimPolicy: Recycle
  nfs:
    path: /nfs/data/grafana
    server: 121.41.10.13
---
apiVersion: v1
kind: PersistentVolumeClaim
metadata:
  name: grafana-data-pvc
  namespace: ns-monitor
spec:
  accessModes:
    - ReadWriteOnce
  resources:
    requests:
      storage: 5Gi
  selector:
    matchLabels:
      name: grafana-data-pv
      release: stable
---
kind: Deployment
apiVersion: apps/v1beta2
metadata:
  labels:
    app: grafana
  name: grafana
  namespace: ns-monitor
spec:
  replicas: 1
  revisionHistoryLimit: 10
  selector:
    matchLabels:
      app: grafana
  template:
    metadata:
      labels:
        app: grafana
    spec:
      securityContext:
        runAsUser: 0
      containers:
        - name: grafana
          image: grafana/grafana:latest
          imagePullPolicy: IfNotPresent
          env:
            - name: GF_AUTH_BASIC_ENABLED
              value: "true"
            - name: GF_AUTH_ANONYMOUS_ENABLED
              value: "false"
          readinessProbe:
            httpGet:
              path: /login
              port: 3000
          volumeMounts:
            - mountPath: /var/lib/grafana
              name: grafana-data-volume
          ports:
            - containerPort: 3000
              protocol: TCP
      volumes:
        - name: grafana-data-volume
          persistentVolumeClaim:
            claimName: grafana-data-pvc
---
kind: Service
apiVersion: v1
metadata:
  labels:
    app: grafana
  name: grafana-service
  namespace: ns-monitor
spec:
  ports:
    - port: 3000
      targetPort: 3000
  selector:
    app: grafana
  type: NodePort
命令:
kubectl apply -f ingress.yaml
kubectl get ingress -n ns-monitor
kubectl describe ingress -n ns-monitor
(6)直接通过域名访问即可
二、Trouble Shooting(问题排查)
2.1 Master
master上的组件共同组成了控制平面
01 若apiserver出问题了
会导致整个K8s集群不可以使用,因为apiserver是K8s集群的大脑
02 若etcd出问题了
apiserver和etcd则无法通信,kubelet也无法更新所在node上的状态
03 当scheduler或者controller manager出现问题时
会导致deploy,pod,service等无法正常运行
解决方案 : 出现问题时,监听到自动重启或者搭建高可用的master集群
2.2 Worker
worker节点挂掉或者上面的kubelet服务出现问题时,w上的pod则无法正常运行。
2.3 Addons
dns和网络插件比如calico发生问题时,集群内的网络无法正常通信,并且无法根据服务名称进行解析。
2.4 系统问题排查
查看Node的状态
kubectl get nodes
kubectl describe node-name
查看集群master和worker组件的日志
journalctl -u apiserver
journalctl -u scheduler
journalctl -u kubelet
journalctl -u kube-proxy
...
2.5 Pod的问题排查
K8s中最小的操作单元是Pod,最重要的操作也是Pod,其他资源的排查可以参照Pod问题的排查
(1)查看Pod运行情况
kubectl get pods -n namespace
(2)查看Pod的具体描述,定位问题
kubectl describe pod pod-name -n namespace
(3)检查Pod对应的yaml是否有误
kubectl get pod pod-name -o yaml
(4)查看Pod日志
kubectl logs ...
Pod可能会出现哪些问题及解决方案
01 处于Pending状态
说明Pod还没有被调度到某个node上,可以describe一下详情。可能因为资源不足,端口被占用等。
02 处于Waiting/ContainerCreating状态
可能因为镜像拉取失败,或者是网络插件的问题,比如calico,或者是容器本身的问题,可以检查一下容器的yaml文
件内容和Dockerfile的书写。
03 处于ImagePullBackOff状态
镜像拉取失败,可能是镜像不存在,或者没有权限拉取。
04 处于CrashLoopBackOff状态
Pod之前启动成功过,但是又失败了,不断在重启。
05 处于Error状态
有些内容不存在,比如ConfigMap,PV,没有权限等,需要创建一下。
06 处于Terminating状态
说明Pod正在停止
07 处于Unknown状态
说明K8s已经失去对Pod的管理监听。